JupyterLab quick start
本地代码调测,使用 JupyterLab
由于我电脑上已经有 python 环境,我安装就使用的 pip
pip install jupyterlab
运行 JupyterLab
jupyter-lab
然后打开浏览器访问http://localhost:8888/
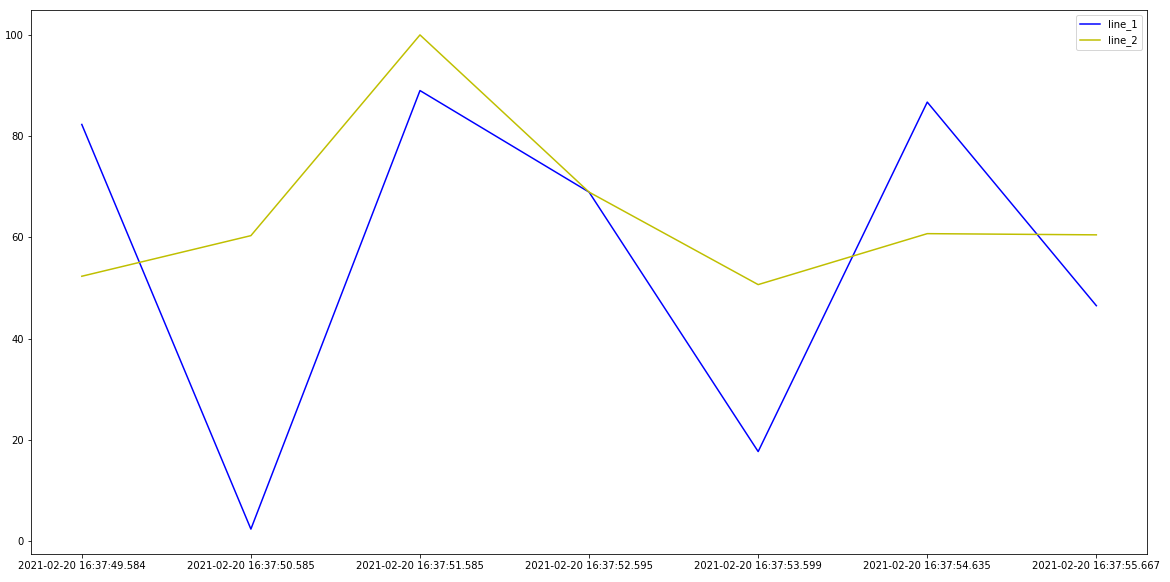
python 绘图这里使用 matplotlib
需要添加引用
import matplotlib.pyplot as plt
from matplotlib.legend_handler import HandlerLineCollection, HandlerTuple
from matplotlib.lines import Line2D
from matplotlib.pyplot import MultipleLocator
设置画布
fig, ax = plt.subplots(1,1,figsize=(20,10))
设置x 、y 序列 和 图例
x_serie=['2021-02-20 16:37:49.584', '2021-02-20 16:37:50.585', \
         '2021-02-20 16:37:51.585', '2021-02-20 16:37:52.595', \
         '2021-02-20 16:37:53.599', '2021-02-20 16:37:54.635', \
         '2021-02-20 16:37:55.667']

values=[82.338, 2.364, 89.038, 68.967, 17.686, 86.758, 46.52]

l1,=ax.plot(x_serie,values,'b',label='x_1')
ax.legend((l1,l2),('line_1','line_2'),loc='best')
横轴数据太过于密集,设置下横轴坐标显示
num = len(x_serie)//8
x_major_locator=MultipleLocator(num)
ax=plt.gca()
ax.xaxis.set_major_locator(x_major_locator)
最后显示效果
plt.show()
遇到的问题
1.
<ipython-input-2-09cf79d39c52>:26: UserWarning: Legend does not support \[<matplotlib.lines.Line2D object at 0x000001B07A8646D0>\] instances.
A proxy artist may be used instead.
如果遇到这错误,
l1,=ax.plot(x_serie,values,'b',label='x_1')
记得前面有个,。
2.
RuntimeError: main thread is not in main loop
matplotlib的默认backend是TkAgg,而FltkAgg, GTK, GTKAgg, GTKCairo, TkAgg , Wx or WxAgg这几个backend都要求有GUI图形界面的
我用来做后端服务运行的是没有图形界面的,所以报错
解决: 改成:指定不需要GUI的backend(Agg, Cairo, PS, PDF or SVG)
import matplotlib.pyplot as plt

plt.switch_backend('agg')